ATS-simulation tools like Jobscan now score resumes on a 0–100 scale against specific job descriptions. The recommended competitive threshold sits at a 75% keyword match rate, and most unoptimized resumes fall well below it. Career counselors report that candidates start seeing results around 65%, but below that mark, your resume is statistically unlikely to surface in recruiter searches or pass automated screening filters used by iCIMS, Workday, Greenhouse, and Taleo.
This gap between what candidates think is competitive and what the data actually shows has turned resume benchmarking into a necessary exercise for serious job seekers. Benchmarking, borrowed from business analytics where companies measure themselves against sector medians across revenue growth, customer satisfaction, and operational efficiency, applies the same logic to your resume: score it, compare it, and identify exactly where you’re falling short of industry resume standards before a recruiter ever sees the document.
The rest of this piece breaks down what the most useful benchmarks actually measure, how to run a competitive resume analysis on your own, and where the data gets less reliable.
How ATS Scoring Tools Measure Competitiveness
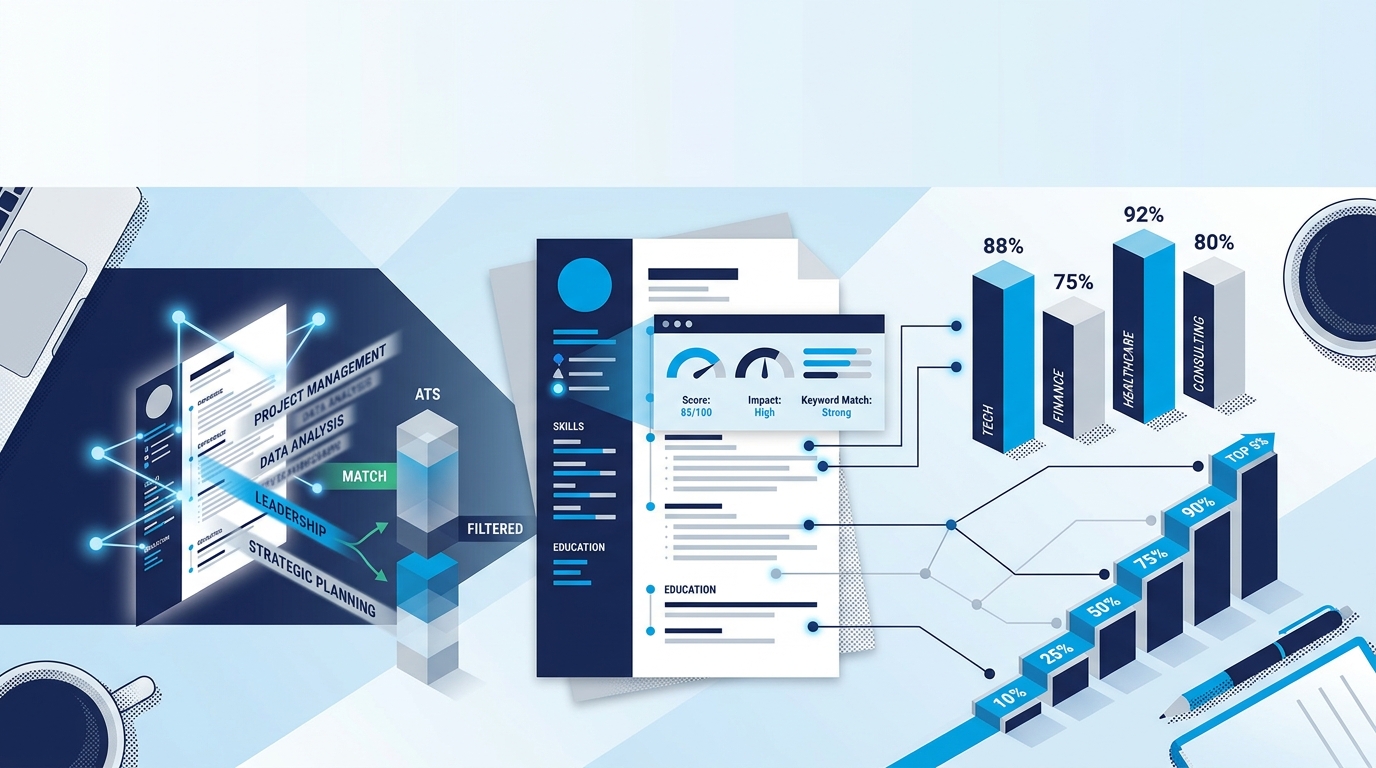
The core mechanics are straightforward. Tools like Jobscan, Resumly, and Scale.jobs parse your resume and a target job description simultaneously, then produce scores across several dimensions: keyword match percentage, formatting compatibility, readability, and section completeness.
Keyword matching is the most heavily weighted factor. Modern ATS platforms use semantic analysis, which means they understand that “project management” and “managed cross-functional projects” are related concepts. This is a meaningful upgrade from older systems that required exact string matches, but it also means your resume needs to demonstrate skills in context rather than listing them in isolation.
Formatting compatibility is the second major scoring dimension. Standard section headings (“Work Experience,” “Education,” “Skills”), single-column layouts, and clean file formats (.docx or text-embedded PDF) all contribute to higher scores. Text boxes, multi-column layouts, graphics, and headers/footers that embed critical information in places ATS parsers can’t read will tank your score before keywords even come into play. We’ve covered why AI-enhanced bullet points often fail ATS systems in detail, and the formatting issues described there account for a large share of low benchmark scores.
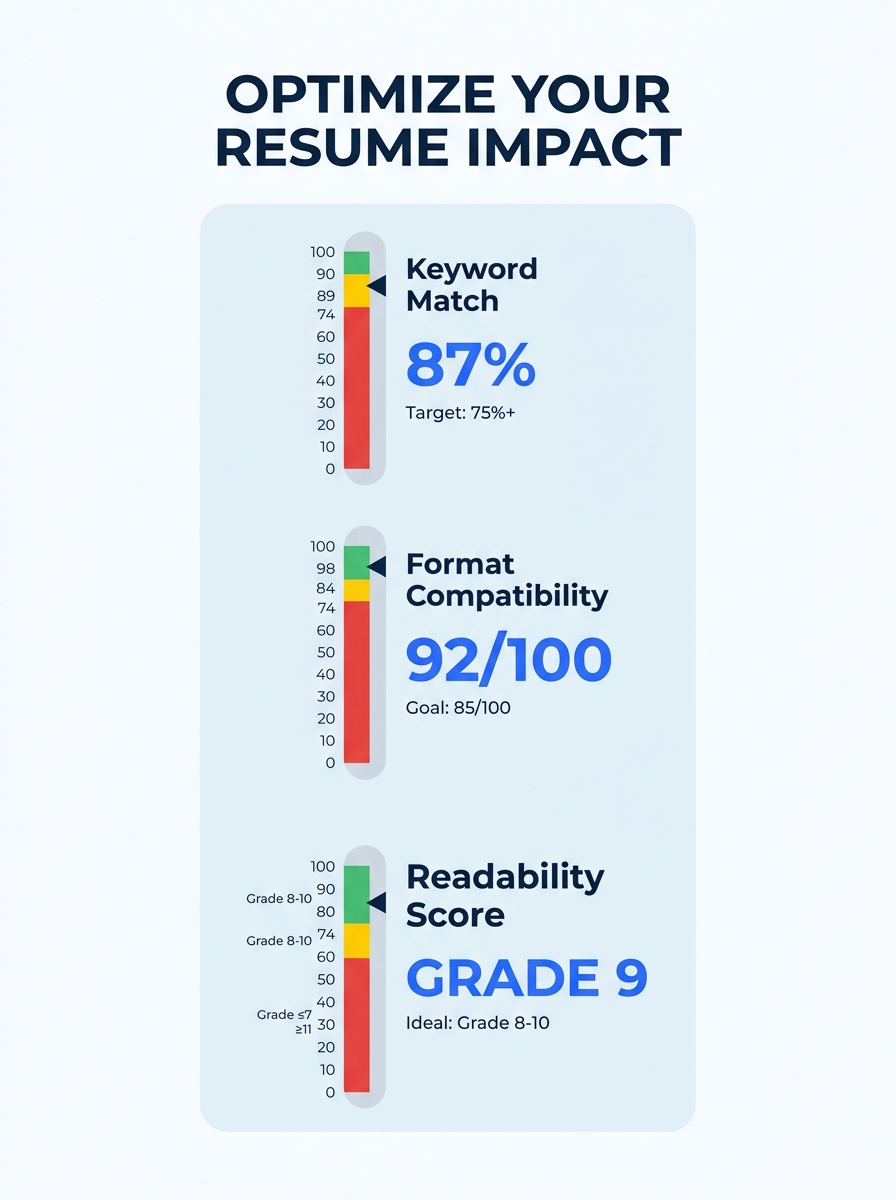
Readability rounds out the scoring. This measures sentence length, vocabulary complexity, and structural clarity. Resumes written at an 8th-to-10th grade reading level consistently score higher because they’re easier for both algorithms and humans to parse quickly. Given that recruiters now average about 11 seconds per resume, readability is directly tied to whether your key qualifications register during that brief scan.
The Three Benchmarks That Actually Predict Callbacks
Not every metric these tools produce deserves equal attention. Based on reported outcomes from career counselors and the tools’ own published data, three resume performance metrics correlate most reliably with interview invitations.
Keyword match rate against the specific job posting. The 75% recommendation from Jobscan is a useful starting point, though the number shifts depending on seniority and specialization. Senior and specialized roles often require higher alignment because the applicant pool is smaller and more tightly qualified. Entry-level roles, where job descriptions tend to be broader, may convert at lower match rates. The key action here is running your resume through an ATS scoring comparison against each posting you’re applying to. A resume that scores 80% against one job description might score 52% against another in the same field if the second employer uses different terminology for the same skills.
Quantified achievement density. Resumes where 80% or more of the bullet points include measurable outcomes consistently outperform those with vague responsibility descriptions. “Managed a team” communicates almost nothing. “Led a team of 8 engineers, delivering 3 product launches in 6 months” communicates scope, accountability, pace, and output in a single line. The X-Y-Z framework (Accomplished X, as measured by Y, by doing Z) is worth studying if you struggle with this. For roles that genuinely don’t produce hard numbers, there are still ways to quantify impact without traditional metrics.
Skills-section structure and placement. The shift toward skills-first hiring means recruiters and ATS platforms increasingly weight the skills section. According to The Interview Guys, five resume formats dominate in 2026, and the skills-first format leads the pack. A categorized skills section (organized by proficiency level or skill domain) that appears near the top of the resume scores higher than a skills list buried after the work history.
A resume that scores 80% against one job description might score 52% against another in the same field if the employer uses different terminology for the same skills.
Running Your Own Competitive Resume Analysis
The process itself takes about 20 minutes per job application and follows a repeatable pattern.
Step 1: Gather your materials. You need your current resume in .docx format and one specific job description you’re targeting. Generic benchmarking against a vague role title doesn’t produce useful data. The more specific the posting, the more actionable the scores.
Step 2: Run the ATS match. Upload both documents to a scoring tool. Record three numbers: overall match percentage, keyword match percentage, and any formatting warnings the tool flags. If your match rate falls below 65%, the resume needs significant keyword work for that particular posting. Between 65% and 75%, you’re in a zone where small edits can produce meaningful jumps. Above 75%, you’re competitive on paper.
Step 3: Compare your skills list to the posting’s requirements. Most scoring tools will highlight keywords present in the job description that are missing from your resume. This is where the real editing happens. You’re looking for skills you genuinely possess but haven’t mentioned, or skills you’ve described using different language than the employer uses. If the posting says “stakeholder management” and your resume says “worked with cross-functional partners,” the meaning is similar but the match won’t register in older ATS parsers.
Step 4: Benchmark your bullet points. Read each bullet and ask whether it contains a measurable outcome. Count the ratio. If fewer than half your bullets include a number, percentage, dollar figure, or timeframe, you’re below the benchmark that predicts callbacks. Our piece on using AI keyword analysis to match job descriptions walks through the customization piece of this process in more detail.
Step 5: Check format compatibility separately. Copy your resume into a plain text editor and read what comes out. If sections run together, information disappears, or the reading order scrambles, your formatting is creating problems that keyword optimization alone won’t fix.
Tip: Run this five-step process against your top three target postings, not a single listing. The variation in scores across postings will tell you whether your resume has a systemic competitiveness issue or a targeting problem specific to certain employers.
Why Regional and Industry Context Changes the Benchmarks
National averages obscure meaningful differences in how competitive a resume needs to be depending on where and what you’re applying for. Resume statistics compiled by High5 show that job market competitiveness varies dramatically by metro area. San Jose’s competitiveness index swung from roughly 153.77 in 2024 to about 107.6 in 2025, a shift large enough to change whether a 70% ATS match rate is adequate or insufficient.
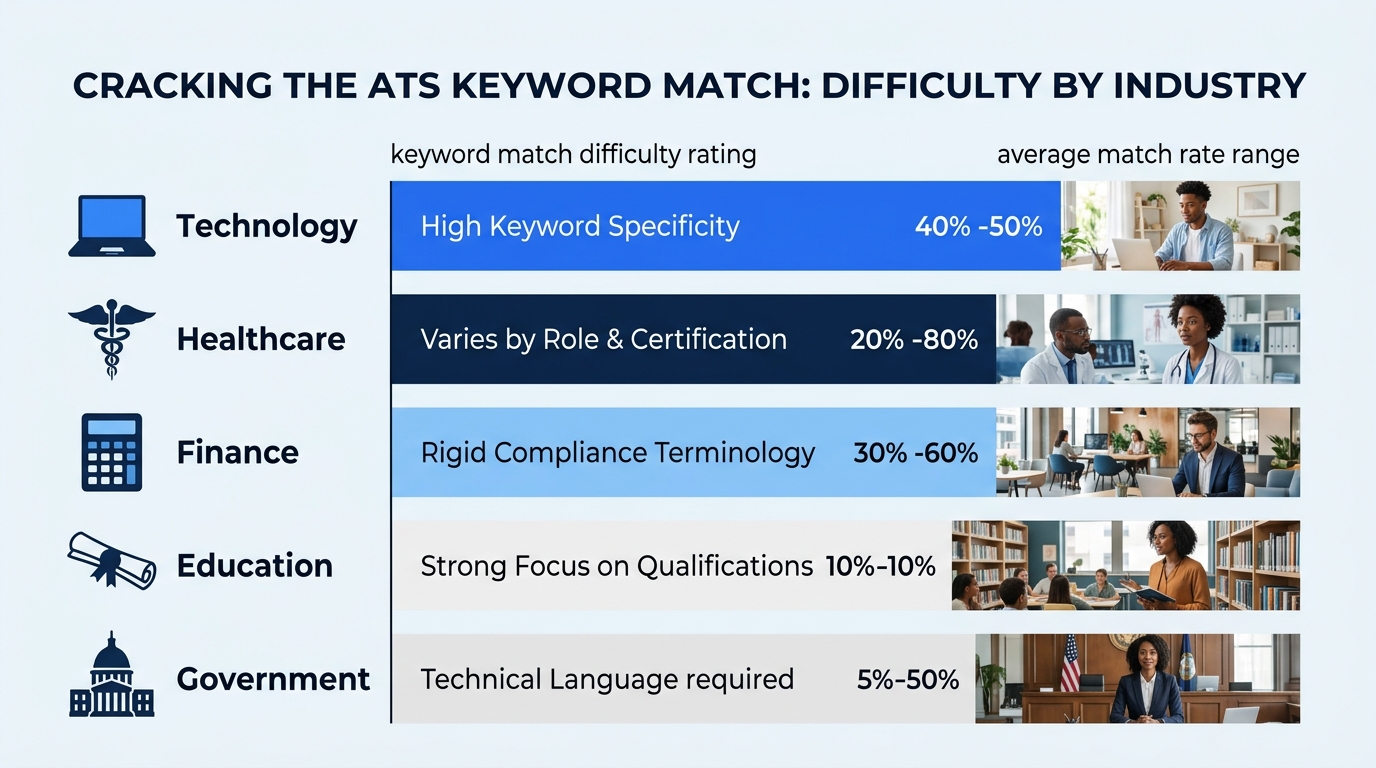
Industry context matters equally. Tech resumes tend to score 5–7 points higher on keyword relevance because skill terminology is more standardized (Python is Python everywhere). Healthcare, education, and public sector roles use more varied language for similar functions, which means the same qualified candidate might need more aggressive keyword tailoring to hit competitive match rates.
This is especially relevant if you’re navigating the competitive screening shifts happening in the current job market, where increased application volume per posting has pushed ATS threshold scores upward in many industries.
The Limits of a Number
Benchmarking tools give you something you’ve never had before: a quantitative read on whether your resume is in the running. That’s genuinely valuable. But the numbers have blind spots worth understanding before you orient your entire job search around them.
ATS scores measure alignment, not quality. A resume can score 90% on keyword match and still bore a human recruiter because every bullet point reads like a job description rather than an accomplishment story. The score tells you whether the document will pass automated filters. It says nothing about whether the hiring manager will find you interesting once they read it.
Benchmarking tools simulate ATS behavior, but they aren’t the actual ATS. Jobscan models how Workday or Taleo would parse your resume, but each employer configures their system differently. Weighting varies. Custom screening questions, internal recruiter preferences, and company-specific parsing rules introduce variability that no external tool can fully replicate.
Over-optimization produces a different kind of problem. If you stuff your resume with every keyword from a job description, you’ll score well on match rate but create a document that reads like a word cloud. Recruiters who’ve adapted to the AI resume flood are specifically watching for resumes that feel algorithmically constructed, and they’re rejecting them. The benchmark you’re aiming for is the sweet spot where keyword alignment is high enough to pass filters but the writing still sounds like a specific human being with a specific career story.
Soft factors remain unmeasurable. Personal branding, network referrals, the quality of your cover letter, and whether your LinkedIn profile reinforces your resume’s claims all influence hiring outcomes. Benchmarking tools can’t score any of that. They give you one lens on competitiveness, and it’s a useful lens, but it’s still partial.
What Still Isn’t Settled
The resume benchmarking landscape is evolving fast enough that several important questions remain open.
Scoring tools disagree with each other. Run the same resume through Jobscan, Scale.jobs, and Resumly, and you’ll get three different numbers. There’s no industry-standard scoring methodology the way there’s a standard credit score algorithm. This means the specific number matters less than the relative movement: did your score go up after edits, and by how much?
The 75% threshold itself is based on aggregated outcomes, not controlled studies. Jobscan recommends it, and enough career counselors have validated it anecdotally that it functions as a reliable heuristic. But the actual threshold where automated filters begin surfacing your resume varies by employer, role level, and ATS configuration. Treat 75% as a strong target, not a guarantee.
Skills-first formatting, which multiple analyses now flag as the dominant 2026 format, works well for roles where demonstrable capabilities matter more than career progression narrative. For executive roles and industries where tenure and trajectory carry significant weight, an enhanced chronological or strategic hybrid format may score lower on some tools but perform better with human reviewers. The tools haven’t fully caught up to measuring format-to-role fit.
What’s settled is the direction. Resume competitiveness is measurable in ways it wasn’t even two years ago, and the candidates who treat their resume as a testable document, running scores, making specific edits, and re-measuring, are producing better outcomes than those relying on gut instinct alone. The scores aren’t perfect. They’re still the best diagnostic tool available for answering the question most job seekers ask themselves every time they hit submit: is this thing actually good enough?