
Resume benchmarking — measuring your document’s achievement metrics, salary positioning, and keyword density against published industry data — converts a subjective self-portrait into a calibrated competitive tool. Three public data layers make this possible without expensive consultants: government wage statistics, employer salary guides, and ATS scoring platforms.
TL;DR: Stack free data from BLS occupational wages, salary guides like Robert Half’s 2026 edition, and ATS scanner tools to audit your resume’s compensation alignment, achievement caliber, and keyword match rate. Candidates who benchmark against real market data write sharper bullets, negotiate better offers, and clear automated filters at higher rates than those who write blind.
Salary Benchmarks Tell You What to Emphasize
Every resume bullet implicitly makes a compensation claim. When you write “managed a $2M budget,” you’re signaling a tier of responsibility that maps to a specific salary band. If that band is below the role you’re targeting, the bullet works against you. If it’s above, you’ve established credibility for a senior-level ask. Salary benchmarks give you the reference frame to know which scenario you’re in.
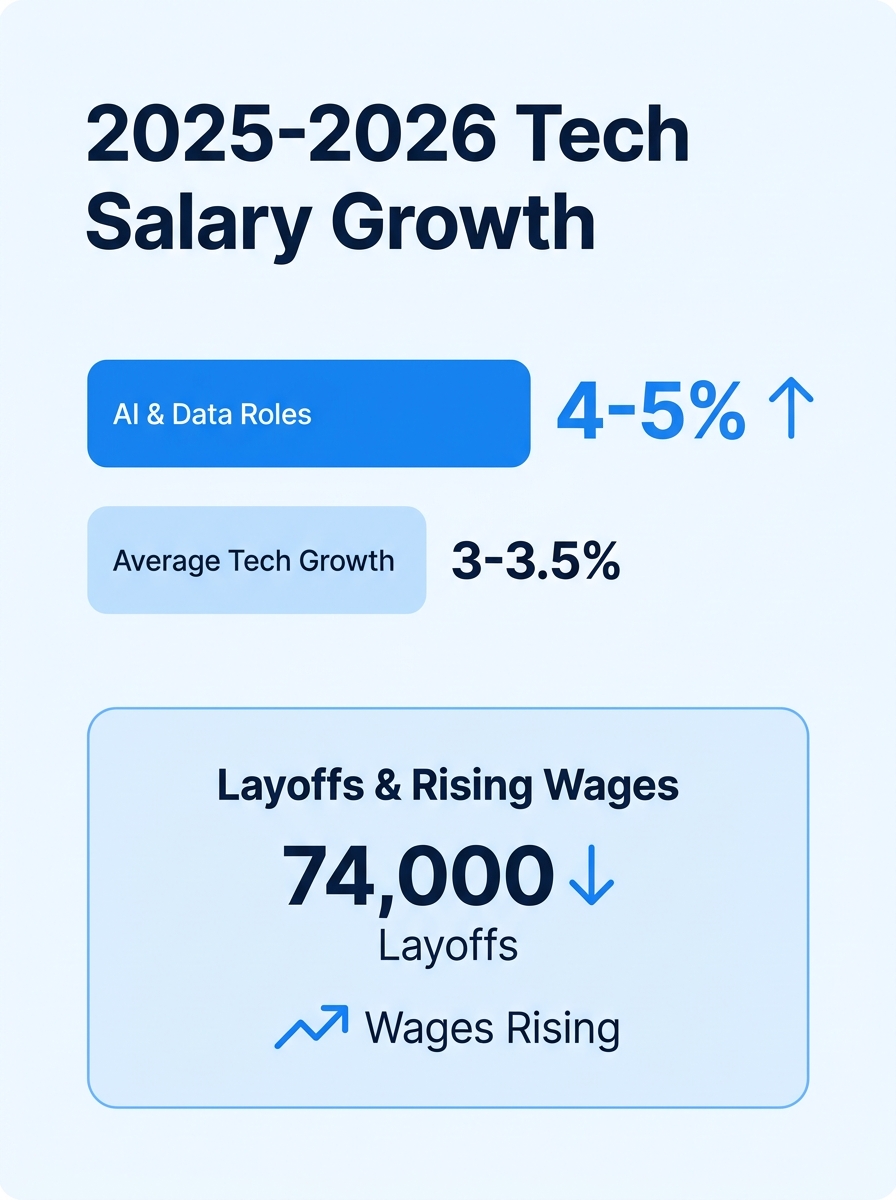
Robert Half has published salary forecasts annually since 1950, and their 2026 Salary Guide covers compensation data across eight industries with breakdowns by job title, experience level, and metro area. The Lorien Global 2026 Tech Salary Guide reports that tech salaries increased by an average of 3–3.5% across most job clusters in 2025, with roles in AI and Data experiencing the highest growth at 4–5% — even as the sector absorbed over 74,000 layoffs.
These aren’t abstract economic reports. They’re resume-writing tools. If you’re a data engineer and the Lorien guide shows your specialty grew 4–5% in compensation while your current salary hasn’t moved, that gap is the story your resume needs to tell. Your bullets should emphasize the specific skills driving that premium: pipeline architecture, model optimization, production ML deployment.
Where to Pull Reliable Compensation Data
Why does source quality matter so much for a resume competitiveness audit? Because self-reported salary data on a single platform can skew 10–15% in either direction depending on who participates. Cross-referencing multiple sources narrows the error band and gives you a defensible number to benchmark against.
According to compensation analysts at PerformYard, employer-commissioned salary surveys “usually provide detailed breakdowns by job title, level, company size, and geography, and are considered highly credible.” Large corporations routinely pay for these tailored reports. You can get much of the same data for free.
Here are the sources worth your time, ranked by reliability for resume benchmarking purposes:
| Source | Data Type | Best For | Cost |
|---|---|---|---|
| BLS Occupational Employment & Wage Statistics | Government-collected employer surveys across 800+ occupations | Baseline median/percentile wages by state, metro, and NAICS industry code | Free |
| Robert Half Salary Guide | Recruiter-verified compensation ranges by title and experience | Mapping your experience level to a market-rate band | Free |
| Lorien Global Tech Salary Guide | Tech-specific salary data for 150+ roles | Identifying which tech specializations command premiums | Free |
| Glassdoor / PayScale | Self-reported employee salary data | Cross-referencing company-specific ranges | Free (basic) |
| Levels.fyi | Self-reported, verified tech compensation including equity | Total compensation comparison for FAANG and mid-tier tech | Free |
The BLS data, which covers 50 states plus territories with breakdowns by occupation, gender, and job complexity, was the gold standard for decades. The program providing detailed job-characteristic breakdowns was discontinued in 2022, but the Occupational Employment and Wage Statistics survey remains active and publishes annual updates. Cross-reference BLS medians against at least one private-sector guide for your industry before you write a single resume bullet.
Calibrating Achievement Metrics Against Industry Baselines
The process of converting vague duties into quantified impact bullets is well-documented. What’s less discussed is how to determine whether the numbers you’ve chosen actually register as impressive to a hiring manager who reviews 200 resumes a month.
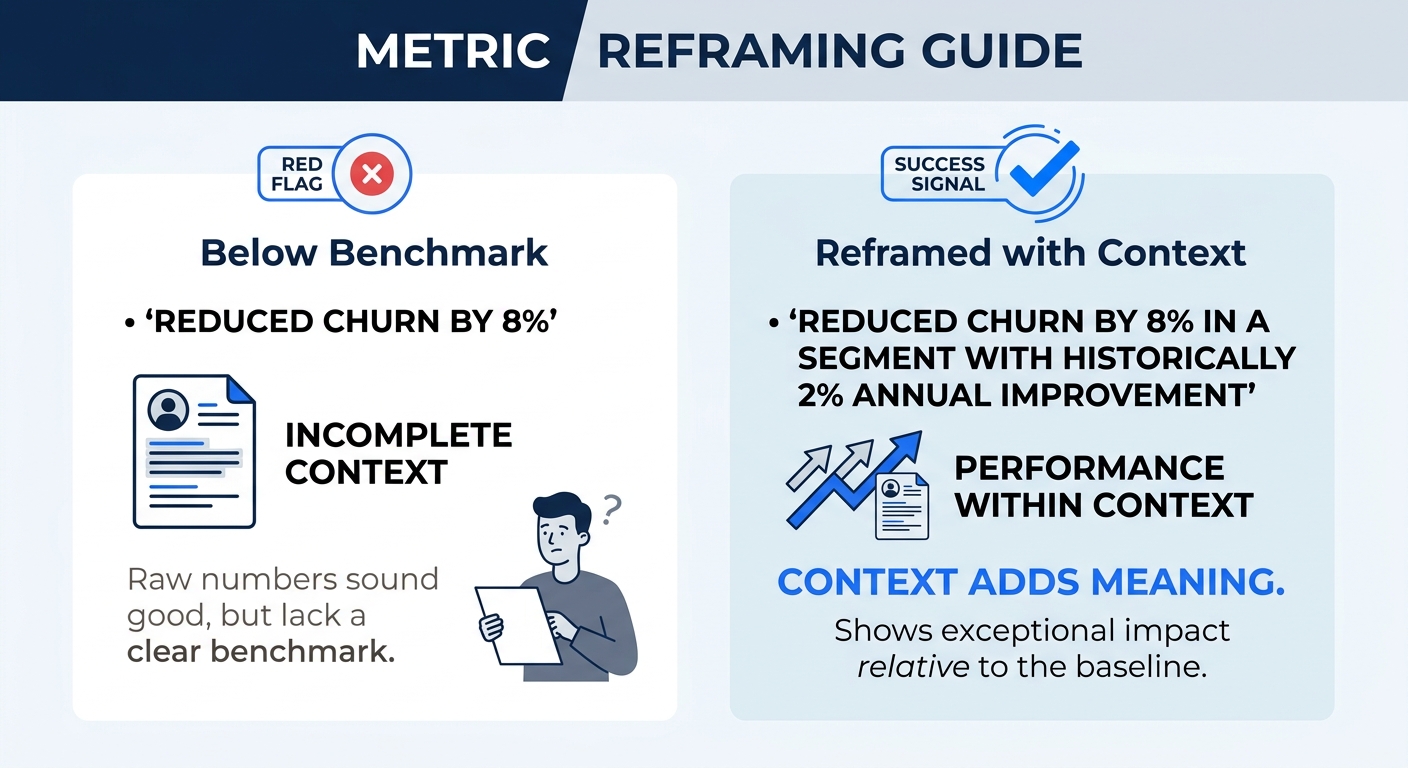
Achievement metrics comparison requires two things: your own performance data and a baseline for what “good” looks like in your role. If you reduced customer churn by 8%, that sounds meaningful in isolation. But if the industry average churn-reduction initiative delivers 12–15%, your number actually signals underperformance. Conversely, a 3% improvement in manufacturing yield might sound modest until you learn the industry baseline improvement is 0.5–1% annually.
Resume Professional Writers recommends that candidates “focus on achievements that had the biggest impact” and build consistency with numbers across the entire resume. That advice gets sharper when you pair it with benchmarking. “Biggest impact” means biggest relative to what your competitors can claim.
Here’s how to find baselines for your achievement metrics:
- Industry reports and benchmarks: SaaS companies publish median metrics (NRR, CAC, churn rates) in annual reports from firms like OpenView or Bessemer. Manufacturing uses OEE benchmarks. Marketing references HubSpot’s annual conversion rate data.
- Job descriptions for the target role: Scan 15–20 postings. The numbers embedded in requirements (“manage budgets of $5M+”, “oversee teams of 10–25”) reveal the employer’s baseline expectation. Your resume numbers need to meet or exceed those thresholds.
- Your company’s own internal dashboards: If your department grew revenue 22% and the company average was 9%, the delta is your bullet. If you track these numbers consistently during employment, you won’t scramble to reconstruct them during a job search.
If the industry average churn-reduction initiative delivers 12–15% and you hit 8%, your “quantified achievement” actually signals underperformance. Benchmarking catches this before a hiring manager does.
Running a Resume Competitiveness Audit With Free Tools
ATS scoring tools give you the other half of the benchmarking equation: how your resume performs as a document, independent of your career achievements. Resumly’s benchmarking methodology measures four dimensions — ATS compatibility, readability, keyword density, and length — against industry standards to produce a data-backed score.
Tools like SkillSyncer scan your resume against specific job descriptions to identify missing keywords, while CV Wolf runs a similar comparison against position descriptions to estimate ATS pass-through rates. Given that nearly 90% of employers now use AI-powered filtering, this kind of competitive resume analysis isn’t optional for serious candidates.
A useful audit covers five checks:
- Keyword match rate: Upload your resume and a target job description. Industry benchmarks suggest a 60–80% hard-skill keyword match for strong ATS scores. Below 50%, most systems deprioritize your application.
- Readability score: Flesch-Kincaid grade levels between 8 and 12 correlate with higher recruiter engagement. Resumes written at a graduate-school reading level (grade 16+) lose attention.
- Achievement-to-duty ratio: Count your bullet points. If fewer than 60% contain a specific number, percentage, dollar figure, or timeframe, you’re underperforming the benchmark for competitive resumes.
- Length calibration: The two-page resume has become standard for candidates with 10+ years of experience, but the content density per page matters more than page count. Aim for 450–600 words per page with at least 40% of that word count allocated to quantified achievements.
- Format compatibility: Plain .docx files with standard section headings (Work Experience, Education, Skills) parse correctly in 95%+ of ATS platforms. Custom headers, tables, and multi-column layouts still cause parsing failures in roughly 1 in 4 systems.
Tip: Run your resume through at least two different ATS scanning tools. Each tool’s parser interprets formatting slightly differently, and the overlap between their results gives you a more accurate picture of your true pass-through rate.
If you’re using AI to help draft your resume, watch for overpolished phrasing that scores well on keyword metrics but triggers human reviewers’ suspicion. The strongest resumes balance algorithmic optimization with authentic voice.
The Three-Layer Benchmark Framework
Bringing this together into a repeatable process, evaluate your resume across three distinct layers before every application cycle:
Layer 1 — Compensation Positioning. Pull the median and 75th-percentile salary for your target title from BLS data and one private-sector guide. Identify which skills, certifications, or scope indicators (team size, budget size, revenue impact) differentiate the 75th-percentile candidate from the median. Ensure your resume contains at least 3 explicit signals of 75th-percentile scope. If your experience genuinely sits at the median, own that positioning — but choose bullets that demonstrate upward trajectory.
Layer 2 — Achievement Metrics Calibration. For each quantified bullet, locate an industry baseline. If the baseline is easy to find (SaaS churn rates, marketing conversion rates, manufacturing yield), include contextual framing in the bullet itself: “Improved pipeline throughput 14% against an industry-average improvement of 3–5%.” If the baseline is hard to locate, at minimum ensure the number exceeds the thresholds stated in job descriptions for your target roles.
Layer 3 — ATS and Readability Scoring. Score your document in SkillSyncer or a comparable tool against 3–5 target job descriptions. Track keyword match rate, missing hard skills, and format parsing errors. Iterate until you achieve a 65%+ keyword match rate with zero parsing failures across all tested descriptions.
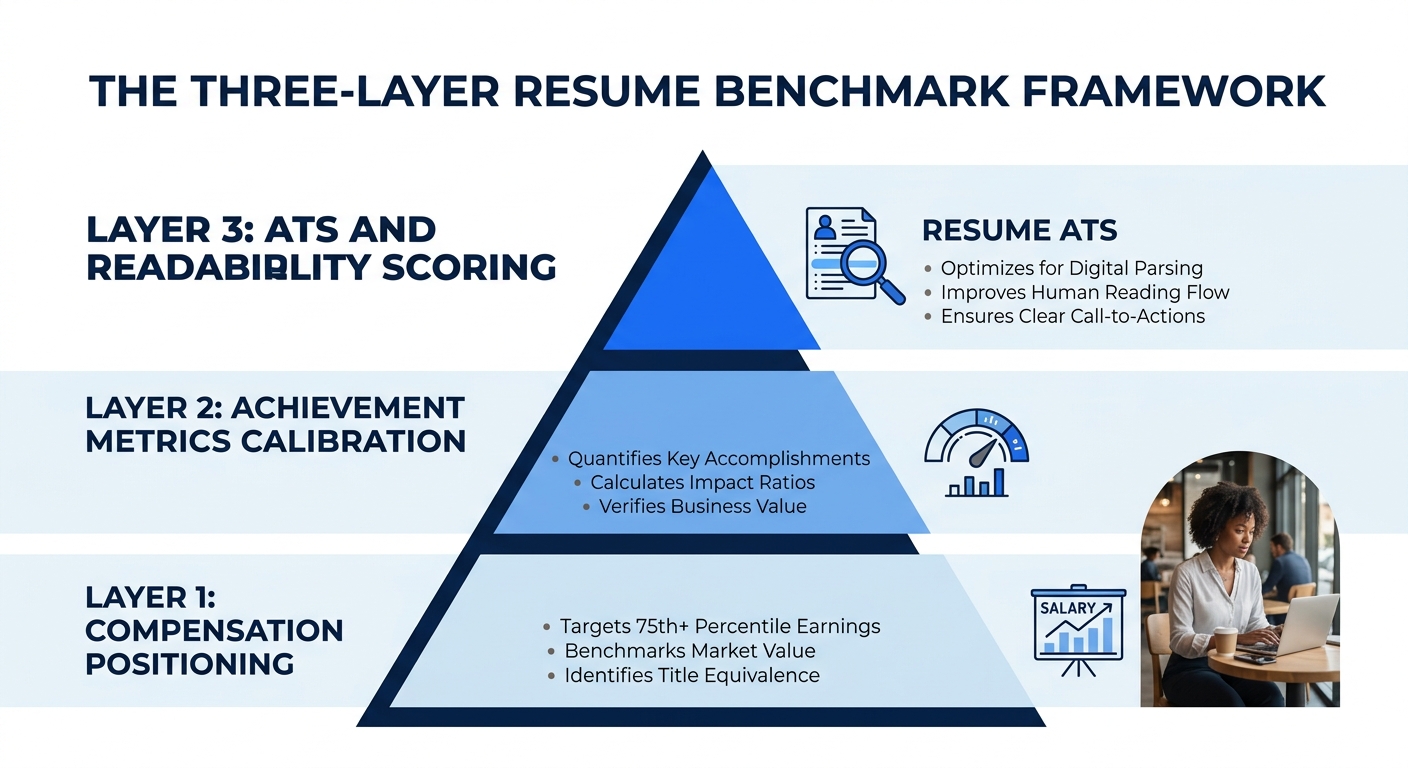
The framework works because each layer catches a different failure mode. Layer 1 prevents you from underselling your market value. Layer 2 prevents you from presenting achievements that sound good in a vacuum but underwhelm in context. Layer 3 prevents your document from being filtered out before a human ever reads it. If you want to go deeper on the AI-assisted auditing side of this process, targeted prompts can automate portions of Layer 2 and Layer 3 — though Layer 1 still requires your own judgment about career positioning.
The Gaps That Benchmarking Can’t Close
Industry salary benchmarks lag reality by 6–12 months. The BLS publishes annual data with a built-in delay; even Robert Half’s guide, updated yearly, captures a snapshot that may shift by the time you’re interviewing. AI and Data roles that grew 4–5% in the Lorien guide’s 2025 data may have accelerated or plateaued by mid-2026. Treat published benchmarks as a floor for your analysis, not a ceiling.
Achievement baselines are even murkier. There is no universal repository of “what good looks like” for a marketing manager’s campaign ROI or a project manager’s on-time delivery rate. Industry associations publish some benchmarks, annual reports from software vendors publish others, and much of the data lives behind paywalls or inside proprietary surveys with small sample sizes. You’ll assemble an imperfect mosaic, and that mosaic will still be more useful than the nothing that most candidates work with.
The ATS scanning ecosystem also remains fragmented. Different employers run different parsing engines, and a resume that scores 85% on SkillSyncer might score 62% on the proprietary parser used by a Fortune 500 company’s Workday instance. Testing across multiple tools reduces risk but doesn’t eliminate it.
What benchmarking does give you is a framework for continuous improvement. Each application cycle generates data: interview callback rates, offer rates, salary offers relative to your target. Track those numbers. A candidate who applies to 87 roles and gets a 2.3% interview rate — as one job seeker documented before switching to a tailored strategy — has a clear signal that something in their document needs recalibration. Benchmarking tells you where to look. The answer is almost always in the gap between what you claim and what the market expects to see. Browse more career guides on our blog to keep narrowing that gap over time.