
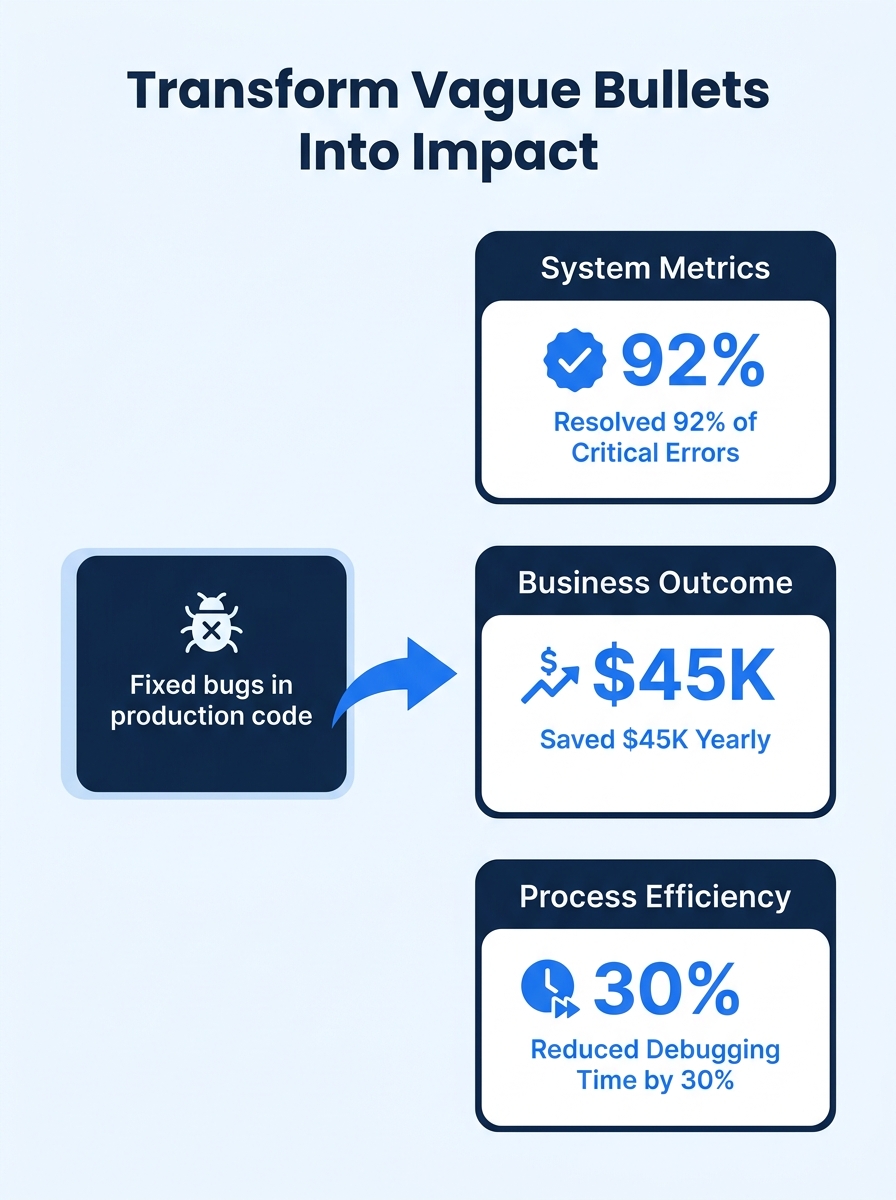
Three distinct methods exist for turning “fixed bugs” into developer resume metrics that hiring managers can evaluate: system-level performance numbers, business outcome translations, and process efficiency gains. Each produces a different kind of bullet, appeals to a different reader, and carries a different risk of sounding fabricated.
TL;DR: Developer resume specificity comes down to picking the right metrics lens for each accomplishment. System metrics work best for infrastructure roles, business outcomes win over non-technical screeners, and process efficiency numbers appeal to engineering leadership. The strongest resumes mix all three but weight them differently per role and audience.
The Core Problem With “Fixed Bugs” on a Resume
Every developer fixes bugs. Writing “identified and resolved software bugs” on your resume describes a job function, not an accomplishment. A recruiter reading that line learns nothing about your judgment, your speed, or the stakes involved.
The real challenge is choosing which numbers to attach to that work. And this is where developers diverge into three camps, each with real tradeoffs. A well-upvoted thread on The Workplace Stack Exchange captures the tension well: experienced engineers warn that inflated resume stats “smell like bullshit, and are more likely to get you rejected than hired.” So the goal here isn’t to invent impressive numbers. The goal is to find real ones you can defend under questioning.
The three approaches below each solve the translation problem differently. I’ll walk through what each looks like on paper, where the numbers come from, and when each approach backfires.
Approach One: System Performance Metrics
System metrics translate bug fixes into infrastructure language: latency reductions, error rate drops, uptime improvements, server load decreases. This is the approach most back-end and infrastructure engineers default to, and for good reason. The numbers come directly from monitoring tools you already use daily.
A strong system metrics bullet reads like this: “Refactored legacy caching layer, resulting in a 50% reduction in server load and a 25% speed increase in page load times.” Another example from CV Compiler’s 2026 resume samples: “Reduced time to fix bugs by 25% through effective use of test-driven development.” Both bullets name a specific percentage tied to a measurable system behavior.
Where the numbers come from
Datadog, Grafana, New Relic, CloudWatch, your APM dashboard. These tools log exactly the before-and-after metrics you need. If API latency dropped from 850ms to 190ms after your fix, that’s a 77% improvement you can cite with confidence. If error reports from users dropped by 50% after you patched a critical codebase issue, that number came from your ticketing system. Bug fix resume language built on APM data is nearly impossible to challenge in an interview because the tool receipts exist.
The tradeoff
System metrics are precise and defensible, but they speak engineering language. A VP of Engineering reads “40% reduction in DB load” and understands the significance immediately. A non-technical recruiter does not. If your resume goes through multiple screening layers, and most resumes now pass through AI filters before reaching a human, the system metric needs enough context that both a keyword scanner and a person get the point.
The other risk is scope ambiguity. “Reduced server load by 50%” sounds impressive until someone asks whether that was across the entire platform or on a single endpoint handling 12 requests per day. Developer resume specificity requires you to name the scope explicitly. “Reduced server load on the payments processing pipeline by 50%, handling 2.3M daily transactions” is a fundamentally different statement than “reduced server load by 50%.”
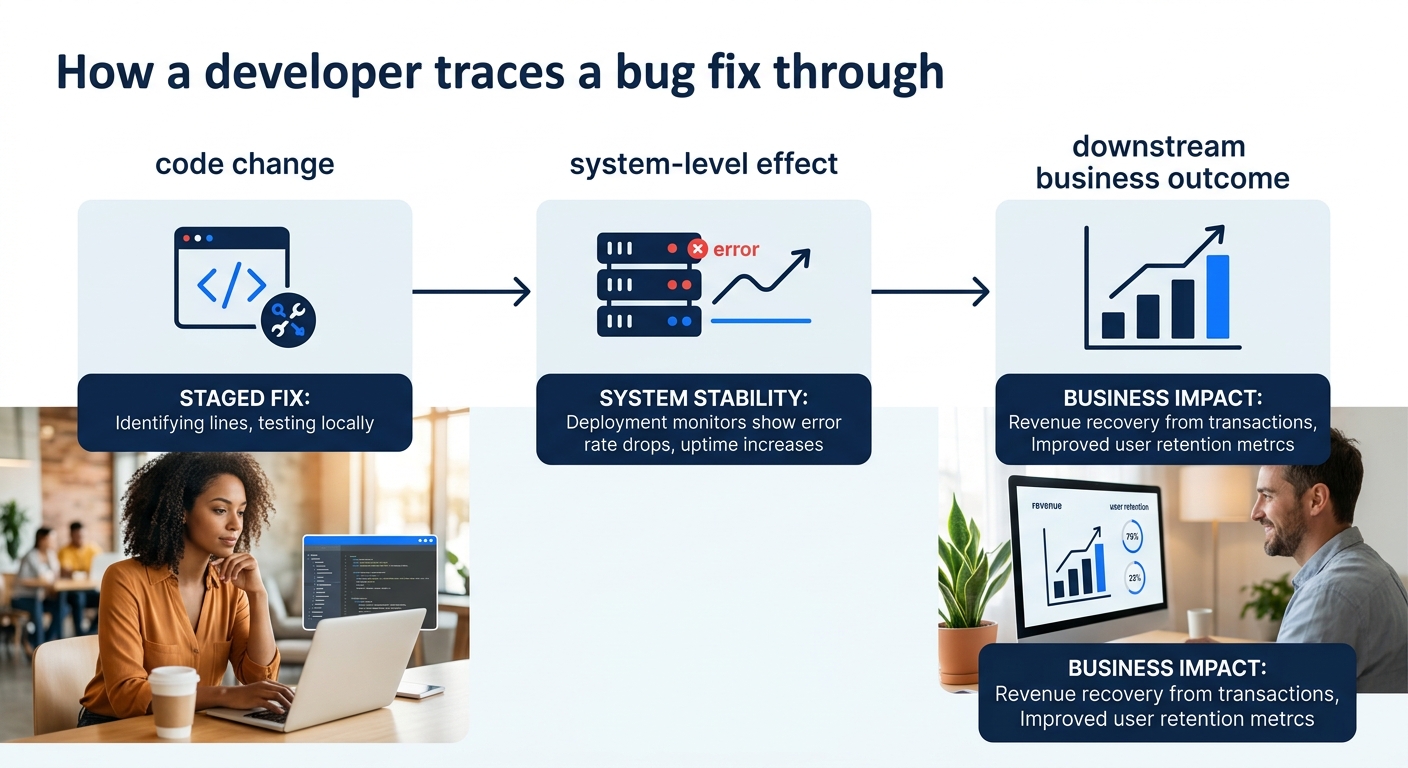
Approach Two: Business Outcome Translation
Business outcome translation converts your technical work into the language of money, users, or retention. Instead of describing what changed in the system, you describe what changed for the company.
The canonical example: replace “Fixed billing system bugs” with “Patched mischarging logic in Stripe pipeline, recovering $7K/month in lost revenue.” The bug fix is identical. The framing shifts from “I did my job” to “I saved the company $84K per year.” Every audience understands dollars. The recruiter who can’t parse “reduced P99 latency by 40ms” absolutely understands “recovered $7K/month.” Product managers, CTOs, and non-technical founders all respond to business impact framing. If you’re applying to a startup where engineering and business sit close together, this is usually your strongest play.
Where the numbers come from
This is where things get harder. Business outcome numbers require you to connect your technical work to a downstream metric that someone else typically owns. You fixed the checkout flow bug, but do you know the conversion rate before and after? You reduced page load time, but can you tie that to the bounce rate change?
Sometimes you can. If your product manager celebrated the fix in Slack with “conversion is up 12% since the deploy,” screenshot that. The best software engineer impact statements come from cross-referencing your git log with product dashboards.
Sometimes you can’t, and this is where the challenge of converting vague duties into measurable outcomes gets especially tricky for developers. Business metrics often have multiple contributing factors. If three features shipped the same sprint your bug fix went out, claiming the full revenue lift feels dishonest. And that Stack Exchange warning applies double here: a hiring manager who has been an engineer will probe these numbers aggressively.
The tradeoff
Business outcome bullets are the most impressive when true and the most damaging when challenged. They require a credible causal line between your code change and a business result. If you can draw that line with data, this approach produces the strongest technical accomplishment quantification on your resume. If you’re guessing or extrapolating, you’ll get caught in a behavioral interview round.
Approach Three: Process Efficiency Gains
Process efficiency metrics describe how your work made the team faster, the codebase healthier, or the development cycle shorter. Think deployment frequency, test coverage percentages, code review turnaround time, incident response speed, onboarding time for new engineers.
An example: “Automated testing and deployments via GitHub Actions, reducing release cycles from 2 days to 4 hours and boosting test coverage from 48% to 85%.” Another: “Introduced structured code reviews that reduced average PR turnaround from 3 days to 6 hours across a 9-person team.”
This approach works particularly well for senior engineers, tech leads, and anyone whose impact shows up in how the team operates rather than in a single shipped feature. If you’ve improved a CI/CD pipeline, written internal tooling, or mentored junior developers, process efficiency is likely your richest source of honest, defensible numbers. The work of framing technical troubleshooting skills for resume impact overlaps heavily with this lens.
Where the numbers come from
GitHub stats, Jira velocity charts, CI/CD pipeline logs, deployment dashboards. If you moved the team from manual QA to automated testing, your CI tool logged the before and after. If you reduced incident response time, PagerDuty or Opsgenie has the data. These numbers tend to be verifiable and specific, which makes them safe to claim.
The tradeoff
Process efficiency bullets impress engineering managers and technical leads. They fall flat with non-technical recruiters who don’t know what “PR turnaround time” means. And they can sound incremental. “Reduced deploy time by 30%” doesn’t carry the emotional weight of a revenue number, even when the organizational impact was larger. If you’re applying through a general recruiter pipeline, these bullets need a brief parenthetical explaining why the metric matters: “Reduced deploy time from 2 days to 4 hours (enabling same-day hotfixes for 50K+ active users)” gives a non-technical reader enough context to care.
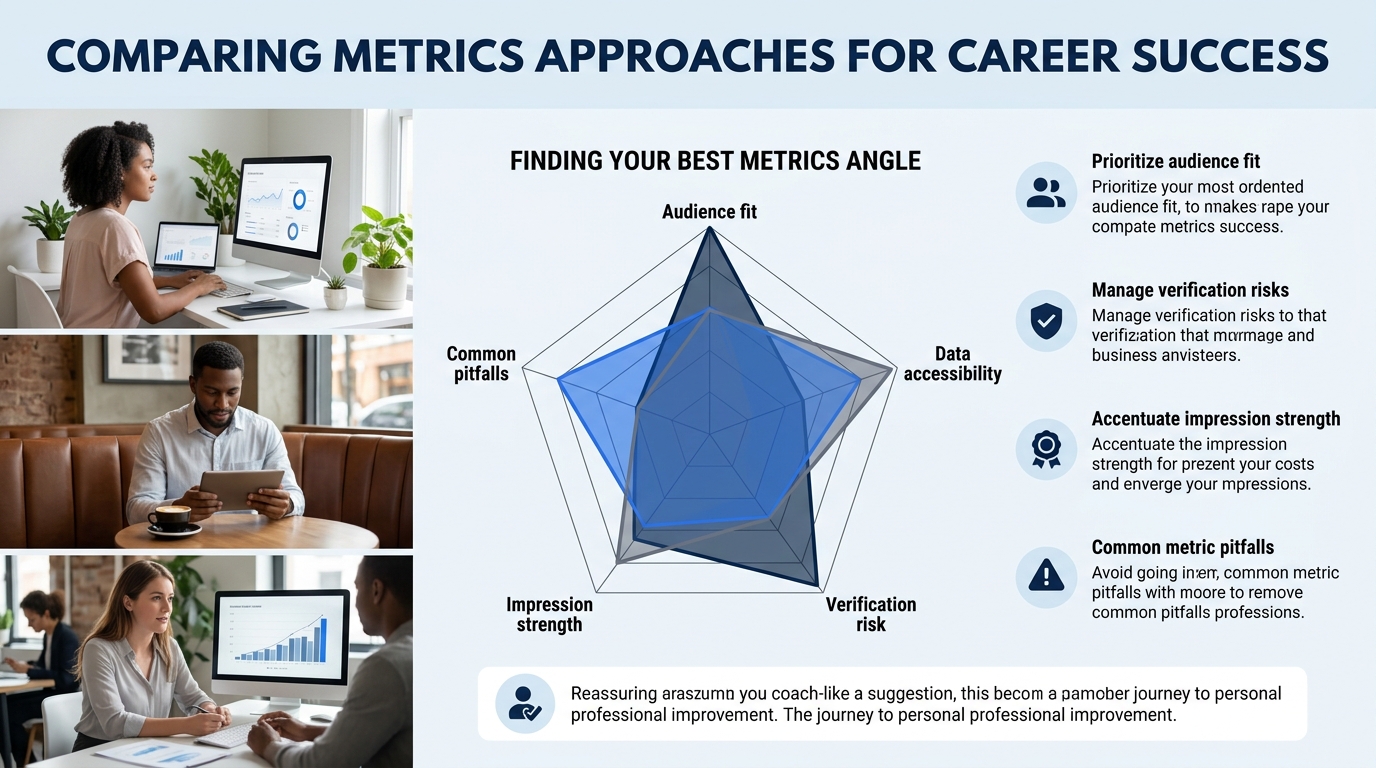
The Comparison at a Glance
| Factor | System Metrics | Business Outcomes | Process Efficiency |
|---|---|---|---|
| Best audience | Technical hiring managers, SRE/infra teams | Non-technical recruiters, startup founders, product leaders | Engineering managers, tech leads, VP Engineering |
| Source of numbers | APM tools, monitoring dashboards | Product analytics, revenue reports, cross-team data | CI/CD logs, Jira, GitHub stats |
| Verification risk | Low | High | Low to medium |
| Impression strength | Moderate — precise but narrow | High — universally understood | Moderate — meaningful to technical leadership |
| Common pitfall | Missing scope context | Overclaiming causation | Sounding incremental |
| Example bullet | “Reduced API error rate from 4.2% to 0.3% across 12 production endpoints” | “Patched billing logic flaw, recovering $7K/month in lost revenue” | “Cut release cycle from 2 days to 4 hours via CI/CD automation” |
How to Pick the Right Lens for Each Bullet
The answer depends on two things: who reads your resume first, and what data you can actually verify.
If your resume goes through an ATS and a non-technical recruiter before reaching an engineer, lead with 1-2 business outcome bullets at the top of each role. They’re the most universally legible. Then layer in system metrics and process efficiency bullets below. Research from Resume Assassin confirms that quantified achievements “provide context to your work, validate your contributions with concrete results, help hiring managers envision your potential, and build instant credibility without overselling.” But that credibility only works when the reader understands the metric you chose.
If your resume goes directly to a technical hiring manager through a referral or a direct application to a small team, system metrics and process efficiency bullets carry more weight. Engineers respect precision. “Reduced P99 latency by 62ms on the search service” tells a staff engineer more about your skill than “improved user experience” ever will.
The strongest developer resumes use all three metrics types, but weight them differently per role and per audience.
And if you’re a senior engineer or tech lead, process efficiency bullets should dominate your most recent role. At that level, your impact shows up in team output, not individual commits. The advice on framing system architecture and migration projects for non-technical readers applies here too; the translation work is similar regardless of your seniority.
Tip: For each bullet, ask three questions before committing to a number. Can I find this data in a tool I have access to? Would I be comfortable if the interviewer asked me to walk through exactly how I measured it? Does the reader I’m targeting understand this metric without a glossary? If any answer is no, switch to a different metrics lens for that accomplishment.
One mistake developers make is treating all roles on their resume the same way. Your current role might warrant 4-5 bullets with heavy process efficiency framing because you’re a tech lead now. Your role from four years ago, when you were a junior developer, might carry 2-3 bullets built on system metrics. Matching the lens to your seniority level at the time makes the career progression story visible without spelling it out. And if you’re pairing your resume with a GitHub portfolio, the guidance on showcasing projects without overwhelming hiring managers keeps the two documents working together rather than repeating each other.
The same principle applies to converting generic duty descriptions into impact statements: the verb anchors the bullet, and the metric makes it credible. Pick a lens that fits your data, your audience, and your seniority. Use a different lens for a different bullet when the situation calls for it. The developers who get callbacks don’t write the fanciest numbers. They write numbers a specific person can understand, and they can explain exactly where every single one came from.